
Visualising distributions
By John Walley
Visualising the distribution of data is something that crops up frequently. This blog post by Dark Horse Analytics does a good job summarising a few of the options available.
I particularly like the rough hand-drawn effect used for the examples. Here's a bar-code chart. Just a simple line plotted for every point.

I've also been looking for an opportunity to try out RoughJS. A small Javascript library that lets you draw in a sketchy, hand-drawn-like, style.
You can probably see where this is going! Here are the results of mixing a little d3 with RoughJS. I'm pleased with the results. The first chart is a bar-code chart. The second is a bee swarm chart. The points are spread out to avoid overlap. This makes it easier to see individual points but can get out of hand for large numbers of points!
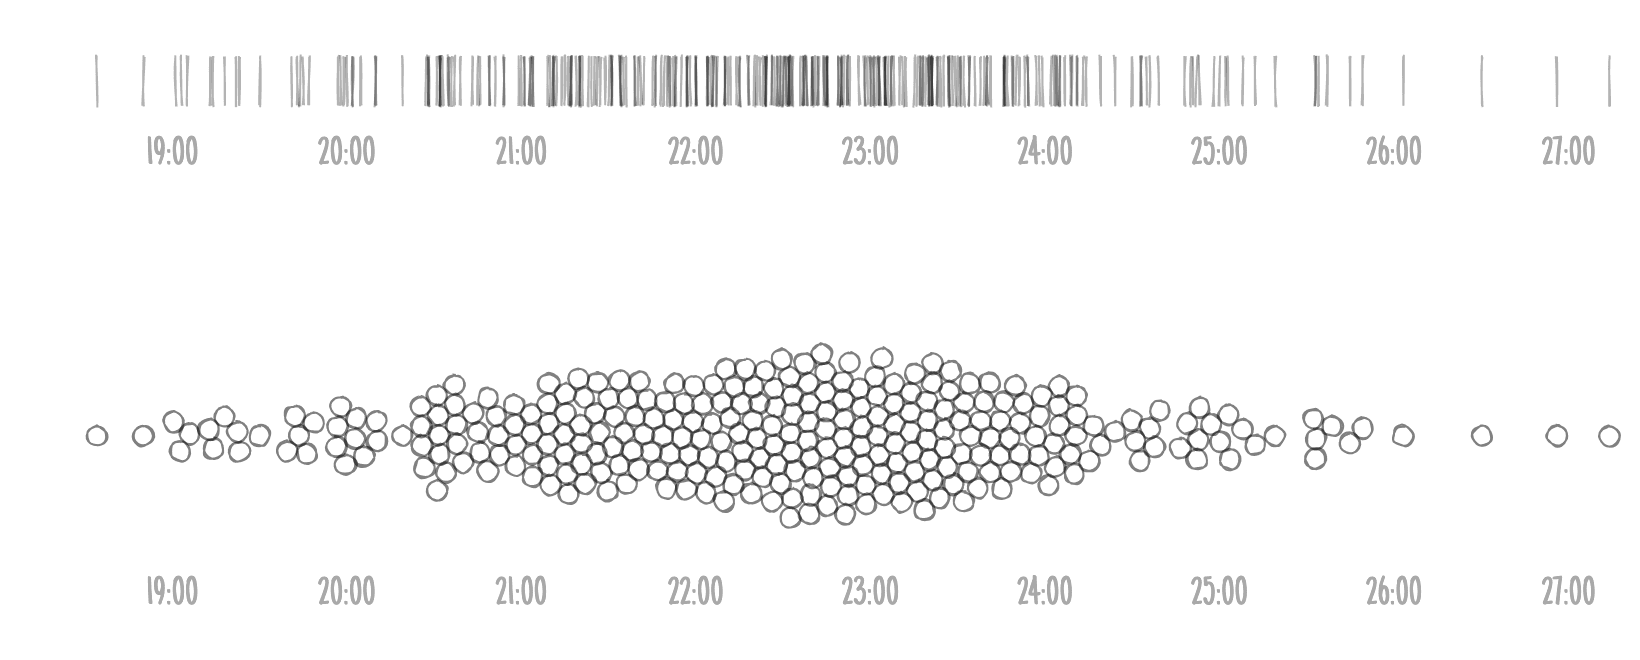
Both charts show the same data (finish times for a rowing race). The source code is also available.